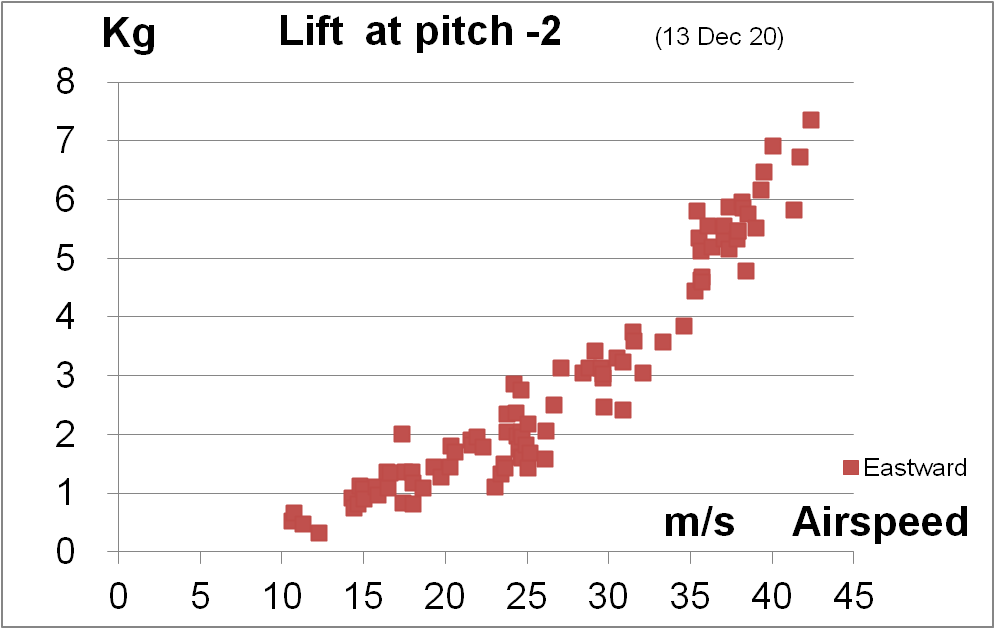
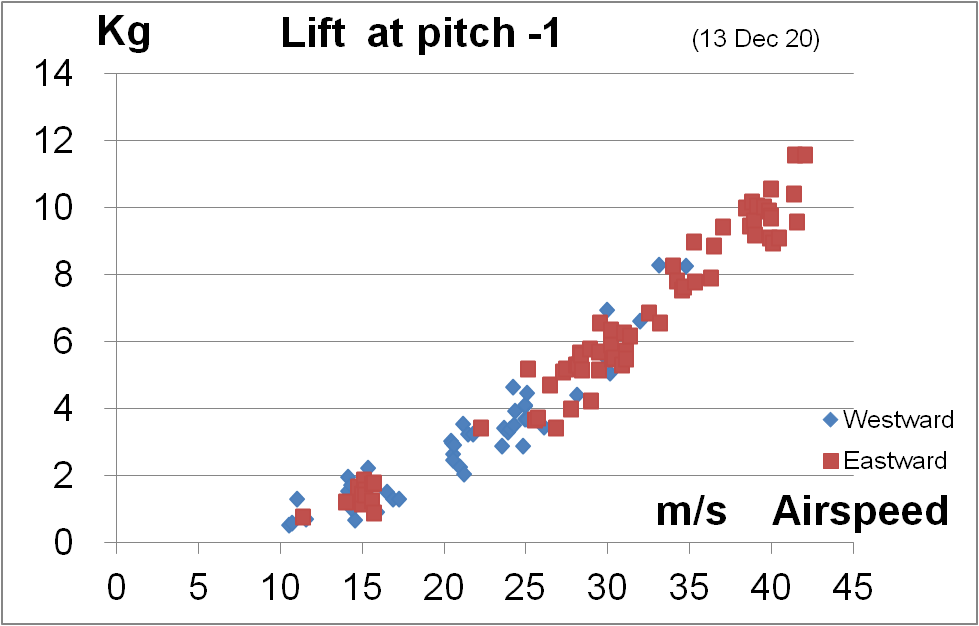
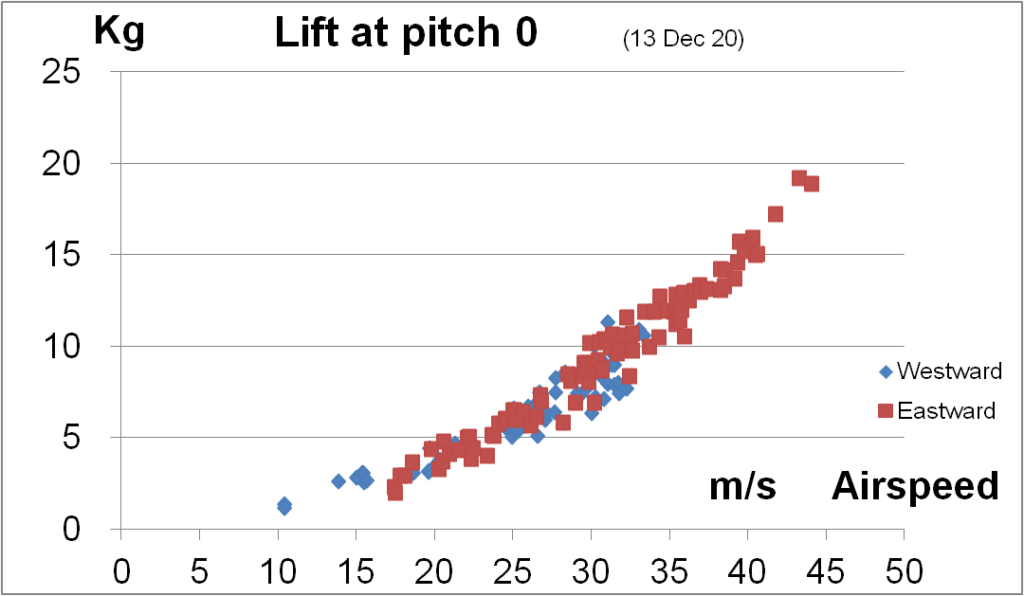
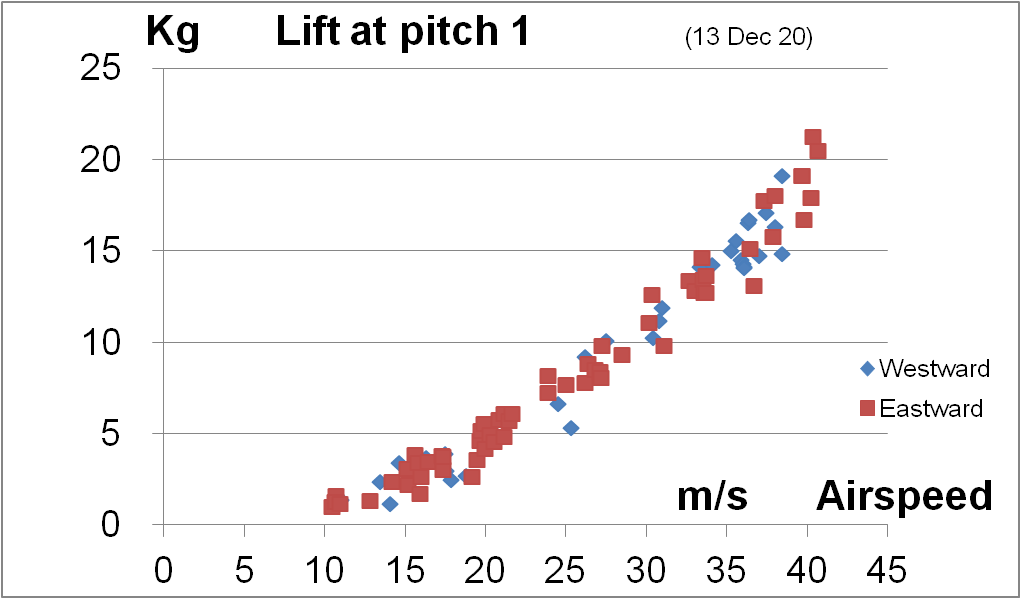
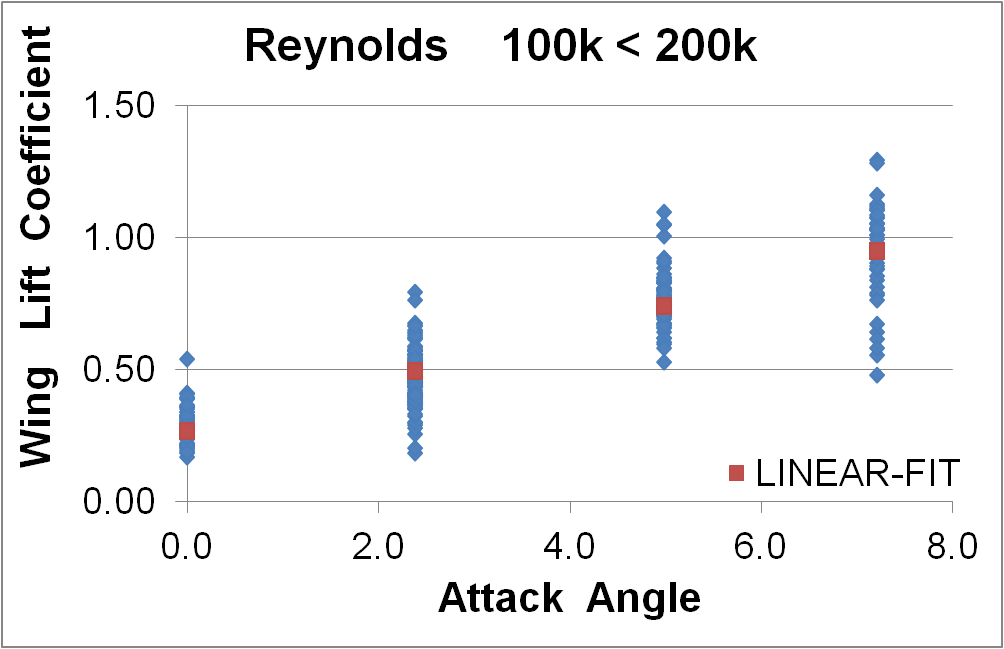
The 1m model wing behavior was measured using a test rig mounted on a car driven on an (approximately) straight road on a rather windy day. Wind gusts account for much of the scatter in the data. The anemometer mounted alongside the wings recorded airspeeds up to 40 m/s, sufficient to record performance at Reynolds numbers up to 300,000, where the length scale is the chord of the leading wing at 1/2 span. The rear wing segment has the same chord. We wanted to check that the wing aerodynamics follow a simple scaling rule at any Reynolds number above 100,000.
These results were sorted by Reynolds Number, and plotted together in two ranges:
100k to 200k :
and the range 200k to 330k :
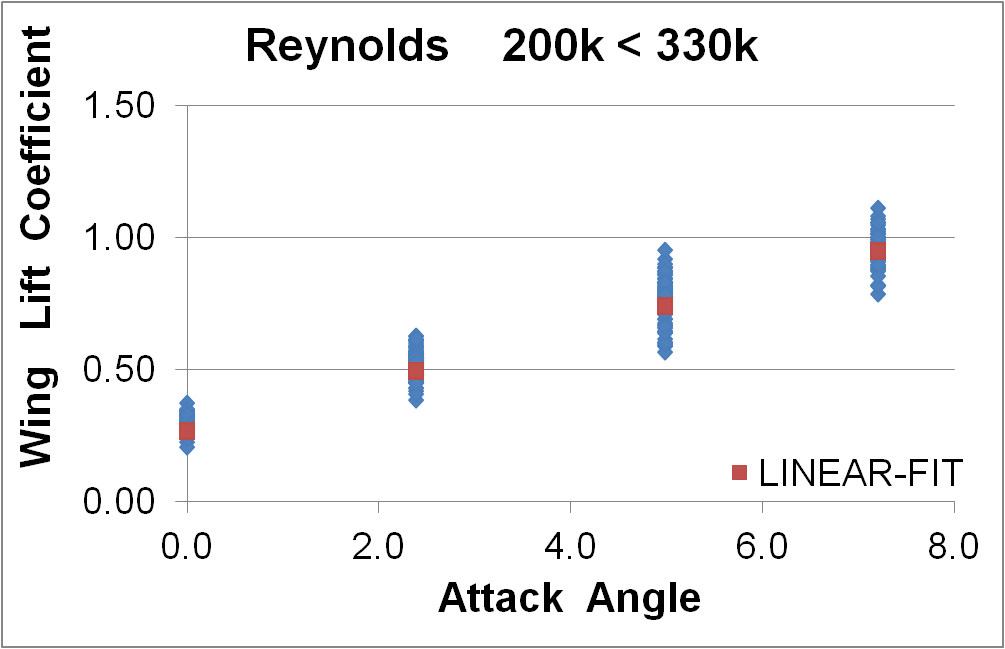
Less scatter because vehicle speed is greater relative to wind gusts.
Finally, the linear best fits for the two ranges were plotted together:
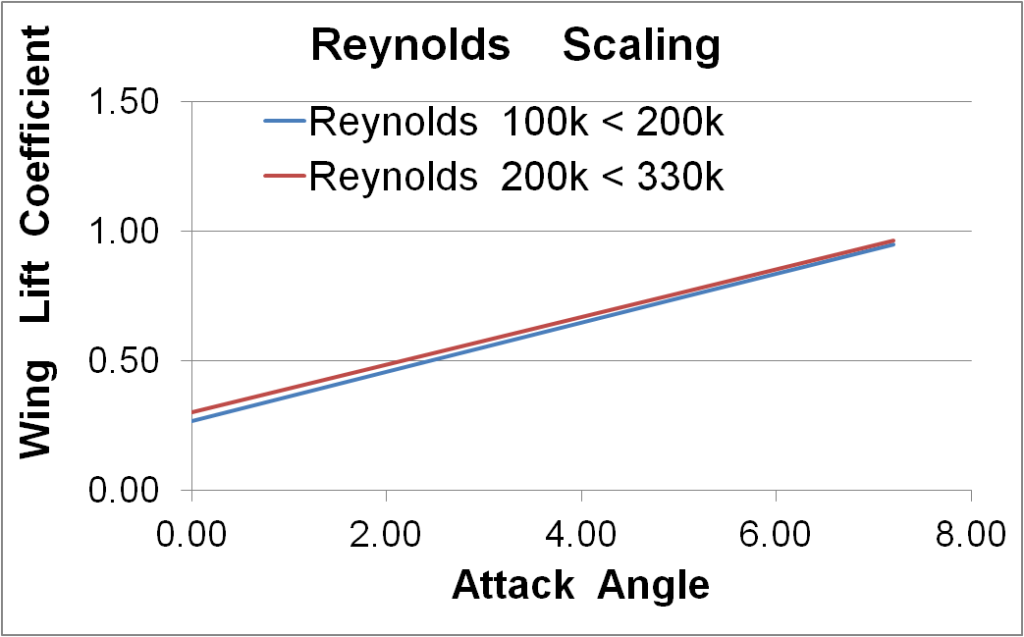
The lift coefficient was found to be much the same in each of these two ranges of Renolds number.
This was interpreted to mean that wing lift will scale in this simple way for any Renolds number above 100k.
Hence we expect model behaviour to be a good approximation of the behavior of a larger aircraft.